


 Buy a licensed company
  VASPs live data and insights
  Learn about crypto safety
  Read the latest research

1. Pinpointing the top countries for growth in the green tech energy space
Global climate developments in 2023
In 2023, the world witnessed numerous pivotal developments in climate change. These events, ranging from policy shifts to natural phenomena, underscored the urgent need for global action and adaptation. Here are the significant occurrences that marked the year.
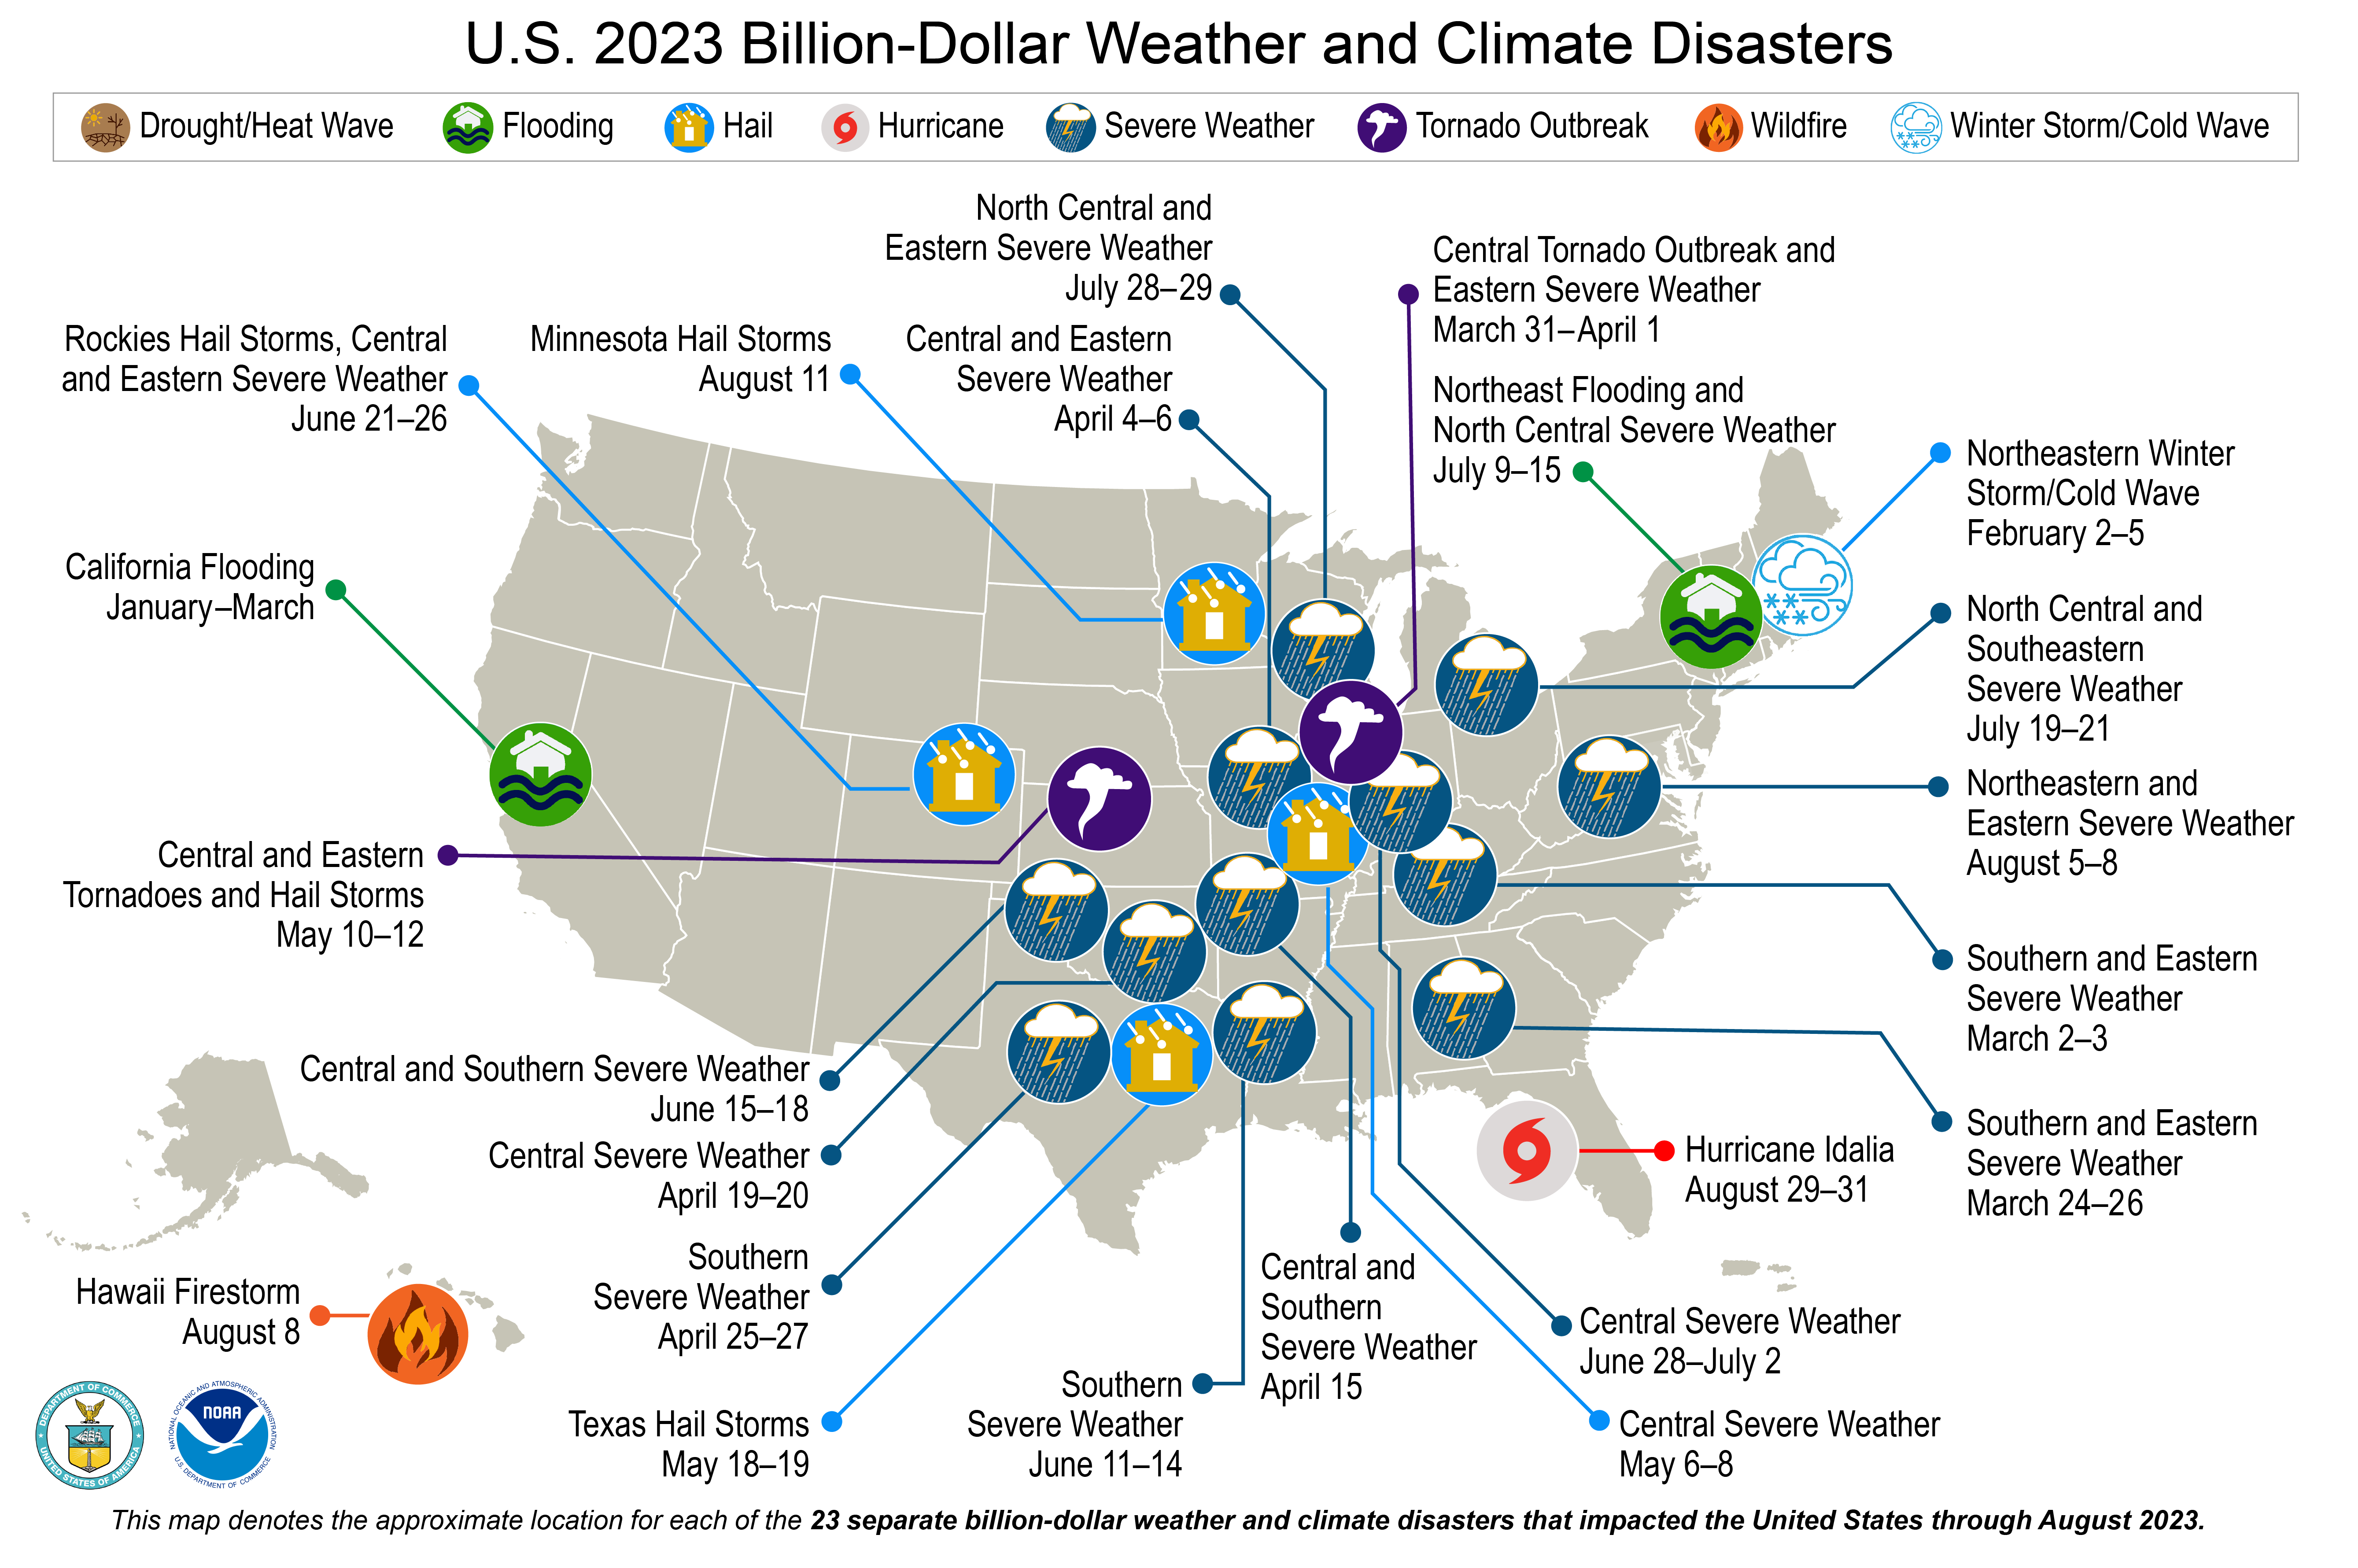
The world is on track to see its hottest year on record. This year marked an increase in the frequency and severity of natural disasters, such as hurricanes, floods, and wildfires, primarily due to weather patterns altered by climate change. From Hong Kong to Dubai, Libya, with over 2000 people dead, and the US experiencing 23 billion dollar disasters, the highest on record, the whole planet seems to have experienced some form of climate-induced events this year.
Economic impacts and policy responses
Climate change’s economic impacts have become more apparent, affecting agriculture, infrastructure, and global markets and underscoring the need for strategies resilient to climate variability. Most messages from governments, organizations, and leaders are positive. Most billionaires are pledging to fight climate change. ESG corporate reports abound, and global organizations are sending alarming messages. However, the billionaire’s energy footprint is disproportionately large, a fossil fuel exec is in charge of COP28 looking for more oil deals, more companies are being accused of greenwashing, while oil companies look “ruthlessly” for growth. As a result, the financial reality is that substantially more money is being spent on Oil and Coal subsidies than on fighting climate change in 2023. The $266 Trillion needed to support the green energy transition is nowhere in sight.
At a government level, several countries announced more ambitious targets for reducing greenhouse gas emissions, reflecting a growing commitment to combating climate change. The US passed the Inflation Reduction Act in 2022, and the EU continues implementing the Fit for 55 policy and REpowerEU. Although the largest investor in renewable energy in the world, China is also the world’s biggest polluter and continues to prioritize the expansion of its coal-fired power plant fleet in the name of energy security, adding two-thirds of the planned 516 GW of new coal-fired capacity worldwide. The new facilities will increase the current capacity by 25% globally if built.
Technological progress and challenges
From a technology standpoint, 2023 witnessed significant progress in renewable energy technologies, with increased adoption and efficiency improvements in solar and wind power. New technologies and solutions emerged, focusing on carbon capture, alternative energy sources, and sustainable practices. However, there is increased criticism of some countries and oil companies that over-rely on Carbon Capture (CCS and CCU) technologies. Countries like the Netherlands, Luxembourg, and Italy and companies like BP were criticized for overelying on CCS tech, which, as of 2023, has been proven unreliable, energy-intensive, economically inefficient, and playing a role in prolonging fossil fuels use.
Renewable Energy Performance Index 2023 insights
Despite facing global criticisms that sometimes border on the absurd, such as the BBC‘s analogy of one Bitcoin transaction being equivalent to a swimming pool of water and the notion that climate capture technologies are mere fronts for selling more oil, it’s bitcoin mining and carbon capture technologies that could very well be the driving forces behind the much-needed breakthrough in the renewables market. This is particularly true in light of the “duck curve” effect, where the mismatch in electricity supply and demand creates challenges in energy utilization. By monetizing the excess energy production, these technologies could significantly enhance the adoption and stabilization of renewable energy grids.
The following index and the data in the report show that although significant progress has been made in adopting renewable energy technologies, there is a huge disparity between different countries and regions worldwide. Utilizing our Renewable Energy Performance Index 2023, we can pinpoint countries that are prime candidates for expansion for companies focusing on wind and solar energy. As the fastest-growing renewable sectors, wind and solar accounted for 85% of 2022’s surge in renewable electricity generation.
1.1 The aim of the index
This index aims at understanding the dynamic, sustainable energy landscape. Based on data analyzed by Coincub between 1965 and 2023, it highlights the diverse trends and concerted efforts underway across different world regions and countries in the journey towards a sustainable energy future.
Our first edition of this index uniquely combines factors such as electric power consumption per capita, the time required to start a business, air pollution levels, electricity prices, carbon emissions, the generation of renewable energy from solar and wind sources, and most importantly their overall contribution as part of the energy mix.
For companies in the emerging green energy sector, this index serves as a roadmap to identify prime markets ripe for investment and growth, aligning with global trends and contributing to the overarching goal of a sustainable, energy-efficient world. In addition, the index serves as a crucial tool for policymakers, environmentalists, and business leaders, offering insights into the interplay between energy consumption, environmental sustainability, and economic activities.
1.2 Methodology
For creating the index in the context of wind, solar, and green energy transition, we focused on relevant factors such as:
- Electricity Generation: This metric indicates the overall size of a country’s energy market. A higher percentage suggests a larger, more developed market, making it a significant factor but not the only one to consider.
- Electric Power Consumption per Capita: This represents the intensity of electricity use in a country. A higher per capita consumption may indicate a more developed economy and a higher potential for market growth in green technologies.
- Time Required to Start a Business: This is a proxy for the business environment’s efficiency. Shorter times suggest a more conducive environment for green tech businesses to establish and expand, reflecting the country’s support for innovation and new ventures.
- CO2 Emissions & Air Pollution: Low CO2 emissions indicate a country’s commitment to sustainable practices and environmental protection. This factor is essential but weighted lower as it’s one of many indicators of a country’s green initiatives.
- Electricity Prices: Higher electricity prices can signal more profitable opportunities for businesses in renewable energy sectors, making this a moderately significant factor in the index.
- Wind Electricity Generation: This metric shows a country’s investment in and adoption of wind energy, reflecting its commitment to renewable energy sources and innovative energy solutions.
- Solar Electricity Generation: Similar to wind energy, this indicates the level of investment in solar energy, an essential component of a diversified and sustainable energy portfolio.
- % of Solar and Wind as of Total Energy Production: This is a critical measure of a country’s commitment to renewable energy. A higher percentage indicates a more significant shift towards sustainable energy sources.
- Population Interest in Wind and Solar Energy: This is a proxy for overall public interest that can sometimes drive government policies and market trends. This factor is essential for understanding the potential consumer demand and support for renewable energy initiatives.
Each index component offers a unique perspective, from market size and economic conditions to environmental commitment and public interest. A significant aspect of this year’s index is the weighting of these dimensions, determined by an expert panel. The panel has assigned heavier weights to specific key dimensions, particularly emphasizing the percentage of electricity generation from solar and wind. This reflects a global shift towards recognizing the importance of sustainable energy sources as critical components of national energy strategies.
Figure 1: The Global Renewable Energy Performance Index – Map
1.3 The Global Renewable Energy Performance Index 2023 – Key highlights
Europe stands out, with several countries like Denmark, Lithuania, Luxembourg, Ireland, and Germany prominently in the top ranks.
- Denmark (Rank: 1, Score: 0.78) – best performance overall, showcasing excellence across multiple parameters and its strong focus on solar and wind energy.
- Germany (Rank: 5, Score: 0.56) – rounds out the top five, with a commendable focus on wind and solar energy generation.
- China (Rank: 23, Score: 0.35) – is noteworthy for its massive contribution to total wind and solar electricity generation despite lower emissions and air pollution scores.
- United States (Rank: 21, Score: 0.37) – shows a balanced approach with substantial electricity generation from solar and wind and a high population interest in renewable energy.
The index comprises the leading 25 nations, while the information presented in the report also encompasses various other global regions to offer a comprehensive overview of the world.
| Country | Rank | Score | Electricity Generation | Electric power consumption (kWh per capita) | Time required to start a business (days) | Air Pollution | Emissions 2022 | Electricity Prices | % of Electricity Generation from Solar and Wind | Total Wind and Solar Electricity Generation TWh | Population Interest in Wind and Solar Energy |
| Denmark | 1 | 0.78 | 0.00 | 0.11 | 0.97 | 0.95 | 1.00 | 0.80 | 1.00 | 0.02 | 0.07 |
| Lithuania | 2 | 0.67 | 0.00 | 0.07 | 0.97 | 0.92 | 1.00 | 0.73 | 0.80 | 0.00 | 0.08 |
| Luxembourg | 3 | 0.64 | 0.00 | 0.26 | 0.89 | 0.95 | 1.00 | 0.42 | 0.79 | 0.00 | 0.12 |
| Ireland | 4 | 0.57 | 0.00 | 0.10 | 0.97 | 0.97 | 1.00 | 0.77 | 0.55 | 0.01 | 0.26 |
| Germany | 5 | 0.56 | 0.07 | 0.13 | 0.91 | 0.92 | 0.94 | 0.78 | 0.54 | 0.16 | 0.08 |
| Netherlands | 6 | 0.53 | 0.01 | 0.12 | 0.98 | 0.92 | 0.98 | 0.66 | 0.52 | 0.03 | 0.09 |
| Portugal | 7 | 0.53 | 0.01 | 0.09 | 0.97 | 0.97 | 1.00 | 0.36 | 0.57 | 0.01 | 0.07 |
| Spain | 8 | 0.51 | 0.03 | 0.10 | 0.91 | 0.96 | 0.98 | 0.39 | 0.55 | 0.08 | 0.09 |
| United Kingdom | 9 | 0.51 | 0.04 | 0.09 | 0.97 | 0.95 | 0.97 | 0.63 | 0.47 | 0.08 | 0.23 |
| Greece | 10 | 0.50 | 0.01 | 0.09 | 0.92 | 0.88 | 0.99 | 0.36 | 0.55 | 0.01 | 0.07 |
| Australia | 11 | 0.48 | 0.03 | 0.19 | 0.99 | 0.97 | 0.96 | 0.30 | 0.42 | 0.06 | 0.55 |
| Uruguay | 12 | 0.47 | 0.00 | 0.06 | 0.96 | 0.96 | 0.32 | 0.59 | 0.00 | 0.00 | |
| Belgium | 13 | 0.46 | 0.01 | 0.14 | 0.98 | 0.92 | 0.99 | 0.83 | 0.34 | 0.02 | 0.07 |
| Chile | 14 | 0.44 | 0.01 | 0.07 | 0.95 | 0.82 | 0.99 | 0.21 | 0.46 | 0.02 | 0.03 |
| Italy | 15 | 0.44 | 0.03 | 0.09 | 0.96 | 0.87 | 0.97 | 1.00 | 0.28 | 0.04 | 0.03 |
| Sweden | 16 | 0.43 | 0.02 | 0.25 | 0.90 | 0.99 | 1.00 | 0.54 | 0.34 | 0.03 | 0.07 |
| Austria | 17 | 0.41 | 0.01 | 0.15 | 0.86 | 0.92 | 0.99 | 0.88 | 0.25 | 0.01 | 0.07 |
| Finland | 18 | 0.39 | 0.01 | 0.28 | 0.89 | 1.00 | 1.00 | 0.47 | 0.28 | 0.01 | 0.06 |
| Estonia | 19 | 0.38 | 0.00 | 0.12 | 0.97 | 0.98 | 1.00 | 0.60 | 0.23 | 0.00 | 0.10 |
| Cyprus | 20 | 0.38 | 0.00 | 0.07 | 0.95 | 0.87 | 1.00 | 0.47 | 0.26 | 0.00 | 0.17 |
| United States | 21 | 0.37 | 0.00 | 0.24 | 0.97 | 0.98 | 0.54 | 0.22 | 0.25 | 0.54 | 0.33 |
| Namibia | 22 | 0.35 | 0.00 | 0.03 | 0.56 | 0.78 | 0.15 | 0.42 | 0.00 | 0.68 | |
| China | 23 | 0.35 | 1.00 | 0.07 | 0.81 | 0.41 | 0.00 | 0.10 | 0.22 | 1.00 | 0.50 |
| Romania | 24 | 0.35 | 0.01 | 0.05 | 0.95 | 0.90 | 0.99 | 0.22 | 0.26 | 0.01 | 0.08 |
| Croatia | 25 | 0.34 | 0.00 | 0.07 | 0.85 | 0.87 | 1.00 | 0.13 | 0.28 | 0.00 | 0.05 |
Table 1: The Global Renewable Energy Performance Index 2023
2. Energy consumption and Financing
2.1 Comparing estimated spending on green energy
Given the complexities involved in global energy transitions, climate change mitigation, and the financial requirements to meet these challenges, the table reflects a view of the current activities, targets, and gaps that still need to be addressed by key countries and regions. The information provided indicates significant investments and initiatives but also highlights the enormous scale of funding required to combat climate change effectively.
There is some significant investment in climate change mitigation, but it needs to be more robust in rising to the challenge. China has the most significant budget at $550 billion, but it leaves a $750 billion/year gap towards its $1.30 trillion/year target. The United States, with est. $390 billion in GHG projects over multiple years currently and a $25.5 trillion GDP still needs to find $1.55 trillion/year. The European Union has a $1.38 trillion/year shortfall against its $1.5 trillion/year goal. India, committing $8 billion, requires an additional $281 billion/year to reach its $289 billion/year target. The rest of the world is facing the biggest gap, currently at an estimated $89 billion and a $3.08 trillion/year gap.
Globally, the current $1.3 trillion/year in climate projects falls short of the needed $8.6 trillion/year by 2030, indicating a critical need for increased climate financing.
| Country/Region | Current Level of Activity (2022/2023) | GDP | Target (Estimated based on global target / per GDP) | Still Needed to Meet Target for 2023 |
| United States | $390 billion in GHG avoidance projects | $25.5 trillion | $1.94 trillion / year | $1,610 trillion/year |
| European Union | Green Deal Industrial Plan, est $162 billion | $16.6 trillion (considering EU-27) | $1.5 trillion / year | $1,38 trillion/ year |
| China | $550 billion, mainly in low-carbon technologies | $18 trillion | $1.30 trillion / year | $450 billion /year |
| India | $8 billion for clean energy (2023–24) | $3.4 trillion | $289 billion / year | $281 billion year |
| Rest of world | $89 billion | $37 trillion | $3.17 trillion / year | $3.08 trillion / year |
| Global (General) | $1.3 trillion/year in climate-related projects | $92.9 trillion | $8.6 trillion/year by 2030, $10 trillion/year through 2050 | $7.3 trillion/year |
Table 2 Estimated vs. Target spent on green energy per region and country
Source: Coincub, Climate Action Tracker, McKinsey
Figure 2. Yearly targets of green energy investment
2.2 Investments in Climate Change Actions
The chart casts a stark light on the allocation of funds in a way that simplifies a very complex issue: climate change investment across leading economies such as the US, EU, China, and India. While these figures represent multi-year strategies rather than a direct correlation with the 9.2% of GDP annually proposed for climate initiatives, the illustration emphasizes the vast discrepancy between current investment levels and what is required to address climate challenges.
It also brings to the forefront the difficulties in mobilizing such large-scale capital. Nevertheless, the urgency of climate investment cannot be overstated, given the dire economic and environmental outcomes of continued inaction.
Climate finance in context
Visualizing these financial flows tells a story of misplaced priorities and missed opportunities. Some growth can be achieved despite the grim picture, particularly through reappropriating funds from fossil fuel subsidies. In 2022 alone, an immense $7 trillion—explicit and otherwise—fueled the fossil fuel industry, according to the Climate Policy Initiative, reflecting data from an IMF study. This is juxtaposed against a substantial $2.2 trillion global military expenditure, shedding light on potential reallocation opportunities that could significantly bolster the fight against climate change.
Figure 3: Climate finance in context
2.3 Regional variations in global energy usage
The data from 1965 to 2022 reveals the shifting patterns of emissions among some of the world’s largest economies. The United States, starting from a staggering 3451.9 million tonnes of CO2 in 1965, experienced fluctuations with a general uptrend, peaking at various points, most notably in the early 2000s. Europe’s emissions followed a similar trend but began a more pronounced decline in the early 1990s, reflecting the region’s early adoption of green policies and sustainable technologies.
While the European Union and the United States peaked in the 2000s, the Asia Pacific region began its accelerated growth phase, primarily driven by China’s robust economic expansion, followed by India’s significant growth in recent years. Over the last several decades, the tale of their energy consumption is a complex narrative of economic development, energy policy, and environmental impact.
Figure 4 Total energy consumption by region
2.4 CO2 emissions by country
Consequently, Asia’s giants, China and India, displayed an exponential rise in emissions. China’s meteoric ascent in CO2 output, from 488.5 million tonnes in 1965 to an astounding 10550.2 million tonnes in 2022, underscores its rapid industrialization and urbanization. Notably, at the beginning of the 2000s, China broke its linear consumption rate and entered an accelerated phase for the past 20 years while passing all other countries.
Though not exponential yet, India’s trajectory shows a significant increase, reflecting its own economic expansion and developmental priorities. The data encapsulates the broader global shift towards Asia as a center of industrial activity and energy consumption, with significant implications for global climate policy and international agreements to curb emissions.
The recent years show a nuanced picture: slight declines or stabilizations in some regions, hinting at the impact of new technologies, energy efficiency improvements, and possibly the effects of global events on industrial activity and energy use.
Figure 5 Global C02 emissions from fossil fuels
2.5 Energy consumption by source
Energy generation and consumption are pivotal aspects of the global energy landscape, each playing a distinct role in shaping environmental impacts. Energy generation refers to producing energy in various forms, primarily electricity, through different sources like fossil fuels, nuclear power, and renewables. Conversely, consumption involves using this generated energy by end-users, be it individuals, industries, or entire nations. Here is the current scale of generation for each energy source.
- Fossil fuels (coal, natural gas, and oil) continue to dominate the global energy mix, with oil being the most consumed energy source at 190.69 exajoules, followed by coal at 161.47 exajoules and natural gas at 141.89 exajoules. This suggests a persistent reliance on traditional energy sources for most of the world’s energy needs.
- Among renewable energy sources, hydropower has the highest consumption at 40.68 exajoules, indicating that it is currently the most utilized renewable energy globally. Wind energy, with a consumption of 19.76 exajoules, also represents a significant portion of the renewable energy mix.
- Solar energy consumption stands at 12.41 exajoules, which, while lower than hydropower and wind, shows its growing importance in the global energy portfolio.
- Biofuels, with 8.69 exajoules, are the least consumed among the listed renewable sources. This might be due to varying adoption and support for biofuel technology across countries.
- Nuclear energy, at 24.13 exajoules, has a notable presence, suggesting that despite debates over its use, it remains a significant source of global energy consumption.
Figure 6 Electricity generation by fuel in 2022 vs 2021
2.6 Energy production/consumption from nuclear, hydro, and renewable sources
Europe and CIS are the regions that had a contraction in energy production/consumption from nuclear, hydro and renewable sources combined in 2022 compared to 2021.
- Asia is the leading region for energy production/consumption from these sources, with the scale exceeding 40 exajoules.
- North America and Europe show similar energy production/consumption patterns from nuclear, hydro, and renewable sources.
- The data points for the Middle East, Africa, and the CIS (Commonwealth of Independent States) are relatively close between 2021 and 2022, indicating smaller and relatively stable energy production/consumption from these sources.
- South & Central America has a modest energy production/consumption scale from these sources, staying within a range under 10 exajoules.
2.7 Green energy trends by country
While countries like Sweden and Finland show modest increases in renewable energy usage, notable European nations like Norway, France, Portugal, and Italy exhibit declines. Vietnam and New Zealand demonstrate significant growth in renewable energy usage. Brazil and Chile show notable increases, suggesting an ongoing commitment to expanding renewable energy in this region.
There is a varied Progress in North America. For example, The United States shows a slight increase, whereas Canada and Mexico exhibit marginal decreases, reflecting varied progress in renewable energy integration across North America. We can see a diverse adoption in CIS and the Middle East. In these regions, changes are minimal or negative, suggesting slower adoption or challenges in increasing renewable energy usage.
Figure 7 Consumption of green energy by region
2.8 Green energy generation across the US states
States across the US are at varying stages of renewable energy integration, each grappling with unique geographical, economic, and policy-driven factors. Vermont, with its 99.7% renewable energy generation, serving as a model for others. Yet, states like West Virginia and Delaware are at the opposite end of the spectrum, with less than 10% of their energy from renewables, indicating potential for growth and investment in green energy infrastructure.
States like Vermont, South Dakota, and Washington, are leading the US in the percentage of their energy generated from renewable sources. These states exemplify the potential of renewable energy to meet a significant portion of energy demand, with Vermont achieving a near-total renewable energy supply.
Addressing the disparity in CO₂ emissions per terawatt-hour among the states. Despite the growth in renewables, states like North Dakota, Wyoming, and Kentucky exhibit high carbon intensity, suggesting a reliance on fossil fuels and an opportunity for cleaner energy policies.
The transition is challenging. Grid reliability, energy storage, and integrating intermittent energy sources like solar and wind require innovative solutions. Bitcoin miners, with their ability to act as ‘controllable loads’, could be one piece of the puzzle in stabilizing the grid as the US moves towards a more renewable-centric energy future.
Figure 8 U.S. energy landscape – Green energy vs Fossil fuel
3. Case Study: Reimagining the Energy Sector – A first-hand account from Exaum’s perspective

The traditional energy framework: A paradigm shift
Exaum stands at the forefront in the evolving energy landscape, challenging conventional categories in the energy sector. Traditionally segmented into Generators, Transmission, Storage, and Consumers, the energy industry is now witnessing a transformative phase. At Exaum, we transcend these traditional roles, focusing on grid balancing with our innovative approach. This emergent need in the energy sector, particularly with the rise of renewable sources, calls for a new category; Balancing – one that we at Exaum are pioneering.
Load balancing: A pivotal role in renewable energy
Renewable energy brings its unique challenges, particularly its unpredictability. Exaum’s role in this new energy paradigm is critical. We aim to balance the grid by efficiently managing the surplus energy from renewable sources. We deliver balancing capacity on the consumption side of the balancing equation. This addresses potential grid instability and marks a strategic shift in energy management from limiting usage during peak times to proactively balancing the grid. It is also a more market-driven approach and drives the industry toward higher efficiency.
Market dynamics and the future outlook
A significant transformation in the energy market is underway, with a noticeable shift towards renewable energy. I foresee the power demand response market growing exponentially, potentially reaching tens of billions by 2030. Exaum is strategically positioned to capitalize on this trend. We focus on developing large-scale consumption assets optimized with our cutting-edge software to balance the grid effectively.
The Exaum pilot: Breaking new ground
The recent launch of our AI-optimized power demand grid balancing pilot in Kotka, Finland, signifies a significant milestone. This one-megawatt system demonstrates our commitment to a sustainable and efficient transition to renewable energy. The pilot system, designed to balance power grids amidst the variability of renewable energy seamlessly, is a beacon of our innovative capabilities.
Client perspectives and economic implications
Our pilot in Karhula Industrial Park is not just an environmental decision but a financially prudent one. As Jorma Hyvänen and Hannu Oksanen, Executive Directors at Karhula Industrial Park, observed, “Our innovative approach to heating our warehouses is both sustainable and economically advantageous.” This feedback underscores the economic viability of our approach, marrying environmental responsibility with cost-effectiveness.
Scaling and innovation
Led by our CTO, Panu Ahola, our team is now focused on expanding and optimizing our system for large-scale operations. The success of our AI-driven power demand response in industrial heating is just the beginning. We are exploring new horizons in energy consumption, aiming to provide cost-effective and climate-friendly energy solutions.
Exaum’s journey illustrates the possibility of a balanced and sustainable energy future. We are not just participating in the energy transition; we are actively shaping it. Our work goes beyond technological innovation; it’s about forging a future where energy efficiency and environmental sustainability are inextricably linked.
Join us on this exciting journey as we continue to push the boundaries of what’s possible in energy management and contribute to a greener, more sustainable world.
Henri Yoki, Founder of Exaum
henri@exaum.com
Download the full data of the report for free at: https://coincub.com/shop/renewable-energy-performance-index-2023/

4. Conclusion
We are facing a pivotal moment in the battle against climate change and the shift towards sustainable energy. Despite the critical need for investment in green initiatives, there’s an ironic contrast with fossil fuel subsidies reaching a record $7 trillion, reflecting a misalignment in global financial priorities.
In 2024, governments and financial institutions must reallocate funds from fossil fuel subsidies to renewable energy and climate resilience initiatives. Countries are urged to enforce more stringent and binding policies to meet emission reduction targets and stimulate investment in sustainable energy sources.
Partners
![]()
Featured Companies
 Canada
  UAE
UAE  South Africa


