


 Buy a Licensed Company
  Explore VASP Data
  Talk to an Expert


How to Track OTC Block Trades in Crypto

- Industry estimates consistently place OTC and off exchange volume at a level that rivals or exceeds visible exchange volume, which means the market most traders analyze is only a partial sample.
- An OTC desk hedges the risk it takes on, and that hedging happens on public venues. The hedge, not the trade itself, is usually your window into hidden flow.
- The cleanest free signal is divergence between exchange reserves and price: reserves falling while price stays flat points to large private buying.
- Onchain settlement flows, stablecoin issuance and futures basis each add corroboration, but every one of them carries a specific blind spot.
- A large share of OTC volume settles bilaterally and never touches a blockchain, so onchain tracking captures a subset of a subset.
- Most retail whale watching fails on four errors: internal transfers, double counting, overfitting and assuming intent from movement.
- The habit that compounds is calibration: read disclosures after the fact, then study what your signals showed during the accumulation window.
The Visible Market Is Only Half the Story
Start with the single number that reframes everything else. Estimates across the industry consistently suggest that OTC and off exchange volume rivals or exceeds the volume you can see on public exchanges. If that holds, then the market analysts scrutinize every day is a large but partial sample of the real one, and any conclusion drawn from order books alone rests on shaky ground.
That has a direct and uncomfortable consequence. When you stare at exchange order books and conclude that nobody is buying, you may simply be looking at the half of the market where nobody is buying, while the other half quietly absorbs enormous size. Accumulation and distribution by the largest players often happen almost entirely off book, and those positions only become visible later, through regulatory disclosures or onchain forensics, usually well after the price has already moved.
What Tracking OTC Flow Can Realistically Buy You
Set expectations before you begin. Tracking OTC flow will never give you certainty, and it will not hand you a mechanical trading system. What it does give you is a wider and better sample of what large participants are doing. That improvement is genuinely valuable, provided you never mistake a better sample for an actual edge. With that framing in place, let us define exactly what you are trying to track.

What Is an OTC Block Trade?
An OTC desk privately matches large buyers and sellers away from public exchanges. Picture a fund that wants to buy $80 million of Bitcoin. It has two realistic options. It can work the order through public order books over hours or days, accepting slippage and broadcasting its intent to every algorithm watching the tape. Alternatively, it can call a desk, request a quote, and execute the entire size at one agreed price.
The second option is the entire reason OTC exists. The desk absorbs the execution risk and charges a spread in return. The buyer receives quote certainty and, just as importantly, information privacy. Nobody watching the public market sees the trade happen.
The Five Stages of a Block Trade
To track something, you first have to know its anatomy. The diagram below shows where a block trade leaves a trace and where it does not.
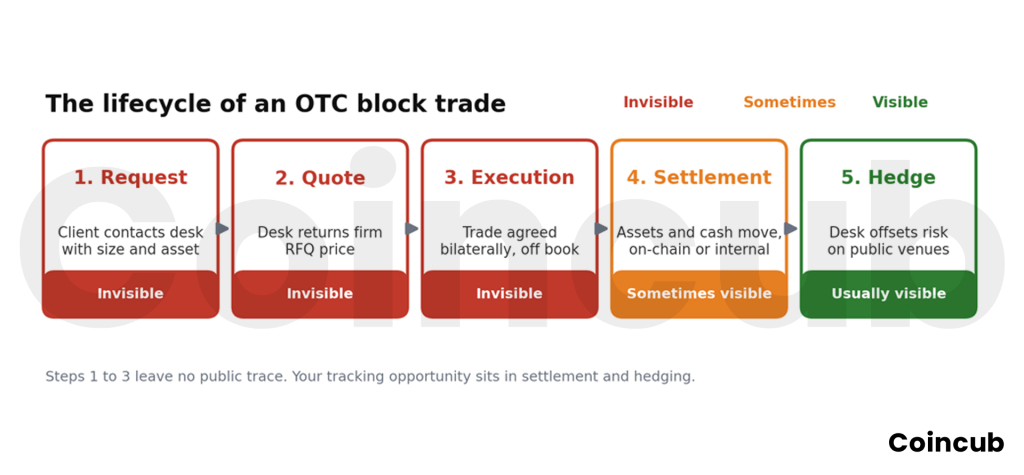
That final stage is the whole game. Desks are not charities, and when a desk sells $80 million of bitcoin to a client, it is suddenly holding a short position it never wanted. So it hedges. That hedging activity plays out on public venues, in the futures market, or through its own inventory management, and it inevitably leaves a footprint. Everything useful in this guide flows from that fact.
Five Main Signals to Track for OTC Block Trades
Onchain Settlement Flows
When an OTC trade settles by moving actual coins, the blockchain records it. The challenge is distinguishing a genuine settlement transfer from ordinary movement, and fortunately these transfers tend to share recognizable traits. They are large and frequently move between two wallets with no prior trading history together. They often involve a known institutional custodian address on one side. And they commonly occur in round or near round amounts, because the trade was negotiated in dollars and then converted.
In practice, three patterns stand out. First, fresh wallet to custodian flows, where a newly created wallet receives several thousand BTC and then routes it to a known custody address, is a classic settlement signature. Second, stablecoin staging, where a wallet quietly accumulates $50 million or more in USDT or USDC without deploying it to DeFi, often precedes a purchase. Third, exchange withdrawal clusters, where a large amount leaves an exchange across several transactions in a short window and then consolidates into one address, is consistent with a desk sourcing inventory to fill an order.
Now the caveat that keeps this signal honest. A significant share of OTC volume never touches a blockchain at all. Desks that settle bilaterally in house, or that hold both sides of a trade with the same custodian, produce no onchain signature whatsoever. Some desks even advertise this explicitly, marketing the absence of an onchain footprint as protection from whale tracking tools. Onchain tracking therefore captures a subset of a subset, which is useful but incomplete by design.
Exchange Reserve Changes Without Price Impact
This is one of the cleanest inferences available, and checking it costs nothing. If exchange reserves fall sharply while price stays flat, then someone bought a large amount without lifting the order book. That combination is genuinely difficult to explain through ordinary spot buying, because public buying of that size moves price, whereas private buying followed by withdrawal does not.
Reading Divergence in Both Directions
The logic runs the other way too. A large increase in exchange reserves without a corresponding price fall suggests coins being positioned for sale through a desk rather than dumped on the open book. To use this in practice, pair a reserve chart with a price chart over the same window and hunt for divergence between the two. Aligned moves tell you very little. Divergence is precisely where the information hides, and it is available to anyone willing to look.
Futures Basis and Funding Rates
When a desk sells spot to a client, it often hedges by buying futures. Do enough of that, and futures prices drift above spot, widening the basis. The pattern worth watching is therefore a widening basis without a matching spot rally, because that combination points to hedging demand rather than directional speculation. Speculative demand usually drags spot up alongside it, whereas hedging demand does not, since the spot side of the trade already happened in private.
Funding rates on perpetual swaps carry similar information. Persistently positive funding paired with flat spot suggests someone is paying to hold long exposure in derivatives while spot stays quiet, which often reflects a desk managing inventory risk. That said, this signal is noisy. Basis and funding move for many reasons, including retail leverage cycles that have nothing to do with OTC flow. Treat it as corroboration for a thesis you already formed from a cleaner signal, never as a standalone trigger.
Stablecoin Supply and Issuance
Large OTC purchases require large stablecoin balances, so following stablecoin issuance gives you a view of the dry powder entering the system. Fresh issuance of several hundred million dollars in USDT or USDC does not guarantee that buying is imminent, because issuance also covers redemptions, market maker inventory and cross venue arbitrage.
Still, sustained issuance over several weeks, particularly when paired with declining exchange reserves, is among the more informative combinations available to a public analyst. One signal alone is weak. Two signals that independently point the same way are considerably stronger, and this pairing is a good example of why you should always read these metrics together rather than in isolation.
Disclosures and Filings
The slowest signal is also the most reliable. Public companies that buy bitcoin must eventually disclose it, funds file periodic reports, and ETF issuers publish daily holdings. These sources tell you what happened, usually weeks after it happened, which makes them useless for trading and extremely valuable for calibration.
Here is how to extract that value. When a filing reveals a large purchase, go back and study what the onchain and derivatives signals were doing during the purchase window. That single exercise teaches you what a real accumulation footprint looks like on your own screens, and almost nobody does it, because it is retrospective work with no immediate payoff. Over time, though, it is the most valuable habit in this entire guide, because it turns raw observation into pattern recognition you can actually trust.
The OTC Block Trade Signal Comparison Table
Not every signal deserves equal weight. The table below ranks them on the dimensions that matter when you are deciding what to trust and how quickly.
| Signal | Speed | Reliability | Cost | Main weakness |
| Onchain settlement flows | Near real time | Medium | Free to moderate | Misses bilateral in house settlement entirely |
| Exchange reserve divergence | Hours to days | Medium to high | Free | Custody shifts can mimic real flow |
| Futures basis and funding | Real time | Low to medium | Free | Very noisy, many non-OTC causes |
| Stablecoin issuance | Days | Medium | Free | Issuance has many purposes beyond buying |
| Whale alert feeds | Real time | Low | Free | Mostly internal transfers, high false positive rate |
| Filings and disclosures | Weeks to months | Very high | Free | Far too slow to act on |
| Institutional flow data | Real time | High | Expensive | Pricing puts it out of reach for most |
Tiers of Tooling, and One Warning
Beyond that free layer, the tooling splits into tiers. Free block explorers and reserve dashboards cover the basics. Mid tier analytics platforms add wallet labelling and cohort analysis. Institutional data products offer genuine flow visibility at a price point that assumes you are managing other people’s money. One structural warning applies across all of them: wallet labelling is guesswork dressed as fact. When a dashboard tells you an address belongs to a specific exchange or fund, that label was inferred from clustering heuristics that are often right and occasionally very wrong. Treat every label as a probability, never as an identity.
Where Whale Tracking Goes Wrong
Four failure modes account for most bad conclusions, and recognizing them is what separates a useful analyst from a noisy one. Understanding these errors will save you more money than any single signal will earn you.
The Four Errors, One by One
The first error is mistaking internal transfers for trades. Exchanges routinely move funds between hot and cold wallets, and these transfers are large, dramatic on alert feeds, and completely meaningless for market direction. This is the single most common mistake in retail whale watching.
The second error is double counting, where one OTC trade generates an exchange withdrawal, a settlement transfer and a custody deposit, and an analyst counting each event separately sees three whales where only one exists.
The third error is overfitting to recent patterns, where a signal that preceded three rallies gathers believers right up until the fourth occurrence fails, because three data points is a coincidence with good marketing rather than a pattern.
The fourth error is assuming intent from movement, because a wallet sending 5,000 BTC to an exchange may be posting collateral, rebalancing custody or providing liquidity. Movement is observable. Intent is not.
A Practical Weekly Routine
Signals only help if you check them on a schedule rather than in a panic. The routine below takes about thirty minutes per week and covers everything worth covering, in a fixed rhythm you can actually sustain.
- On Monday, check aggregate exchange reserves for BTC and ETH against the prior week, and separately check stablecoin supply for USDT and USDC, noting net issuance.
- On Wednesday, review the futures basis and funding rates, watching for divergence from spot rather than the absolute level.
- On Friday, revisit the notable wallet movements flagged during the week and ask, for each one, whether the pattern truly resembles settlement or is more plausibly an internal transfer.
- Then, once a month, read the disclosures and go back to check what your signals showed during the disclosed accumulation window, writing down whatever you missed.
Everything before that monthly step is observation. The monthly step is calibration, and calibration is what compounds.
What Tracking OTC Flow Can and Cannot Give You
Tracking OTC flow gives you context. It tells you when large participants appear to be accumulating or distributing outside public view, and it occasionally offers early warning of a supply shift before that shift reaches the price. Used well, it widens your field of vision in a market designed to keep you half blind.
It does not, however, give you a trading system. The signals lag, they frequently conflict, and the largest and best informed flow is specifically engineered to be invisible. Desks compete on discretion, so any signal that becomes widely followed creates an incentive for the people generating it to route around it, and they have both the budget and the motivation to do exactly that. The realistic goal is a wider sample of the market, not a complete one. That is well worth having, as long as you never confuse it with certainty.
Frequently Asked Questions (FAQ)
What is an OTC block trade in crypto? +
It is a large trade matched privately between a buyer and seller through a desk, executed away from public exchange order books to avoid slippage and information leakage.
Can you see OTC trades on the blockchain? +
Sometimes. Trades that settle by moving coins onchain leave a record, while trades settled bilaterally on a desk's internal ledger, or within a single custodian, leave no onchain trace at all.
How much crypto volume is OTC? +
Precise figures are not published, but industry estimates consistently place OTC and off exchange volume at a level that rivals or exceeds visible exchange volume.
What is the best free tool for tracking whale activity? +
Lookonchain is widely regarded as the highest signal free option, combined with public exchange reserve dashboards and stablecoin supply charts.
Why do exchange reserves matter for OTC tracking? +
Falling reserves without a matching price rise suggest large buying that bypassed public order books, and that divergence is one of the cleanest available inferences about hidden flow.