


 Buy a Licensed Company
  Explore VASP Data
  Talk to an Expert

 Atis Shala
Atis is a senior analyst and community lead with four years of experience in crypto. He has a bachelor from the Rochester Institute of Technology.
Atis Shala
Atis is a senior analyst and community lead with four years of experience in crypto. He has a bachelor from the Rochester Institute of Technology.
IOTA (IOTA) Price Prediction 2026-2030

- Trading at approximately $0.047 with a market capitalization around $220 million as of September 2026, IOTA has rebounded roughly 50% from its July 2026 all-time low of $0.0311, though it remains down over 99% from its December 2017 peak.
- The project underwent a fundamental architectural overhaul in May 2025, transitioning into a delegated Proof-of-Stake Layer-1 network integrated with Move smart contracts and the Starfish consensus engine.
- Long-term adoption relies heavily on real-world enterprise trade integration, highlighted by ongoing government trade digitization deployments in the UK and African nations including Kenya, Nigeria, and Morocco.
- Price growth faces persistent supply inflation from daily staking reward emissions (~767,000 IOTA/epoch) and scheduled unlocks continuing through late September 2027, requiring expanded network activity and staking lockups (~48% currently locked) to absorb the new supply.
- Forecast scenarios outline a 2026 price range of $0.030-$0.040 in the bear case to $0.075-$0.10 in the bull case, with the 2030 outlook spanning $0.02-$0.04 (bear) to $0.15-$0.30 (bull) depending on enterprise trade scaling, real-world asset tokenization, and Move DeFi expansion.
How is IOTA Performing?
IOTA trades at about $0.047 as of 22 September 2026, giving it a market capitalisation of roughly $220 million, according to CoinMarketCap. The token hit an all-time low of $0.0311 on 31 July 2026 and has since recovered about 50%, although it remains more than 99% below its December 2017 peak, the starting point for any IOTA price prediction.
IOTA stays relevant to investors because the project has rebuilt itself almost entirely. Since May 2025, it has run as a delegated proof-of-stake layer-1 with Move smart contracts, and it is now being deployed in government trade programmes in Africa and the UK. IOTA’s future price therefore depends on one question: can network utility and staking demand absorb a supply that grows every day through staking emissions and scheduled unlocks, offset only partly by fee burning? Every IOTA price forecast below is a scenario range, and none of them is a guaranteed outcome.
IOTA Price Prediction at a Glance
Before looking at each year, the snapshot below shows where IOTA stands today, combining live market data with IOTA Foundation figures.

| Metric | Value |
|---|---|
| Current price (22 September 2026) | About $0.047 |
| Market capitalisation | About $220 million |
| Circulating supply | About 4.65 billion IOTA |
| Total supply | Just under 5 billion IOTA, with no fixed maximum |
| All-time high | $5.25 to $5.69 (December 2017, varies by data provider) |
| All-time low | $0.0311 (31 July 2026) |
Those numbers describe a token trading near historic lows while its supply keeps rising. With that in mind, the table below sets out our scenario ranges, including the circulating supply each year assumes.
| Year | Assumed supply | Bear case | Base case | Bull case |
|---|---|---|---|---|
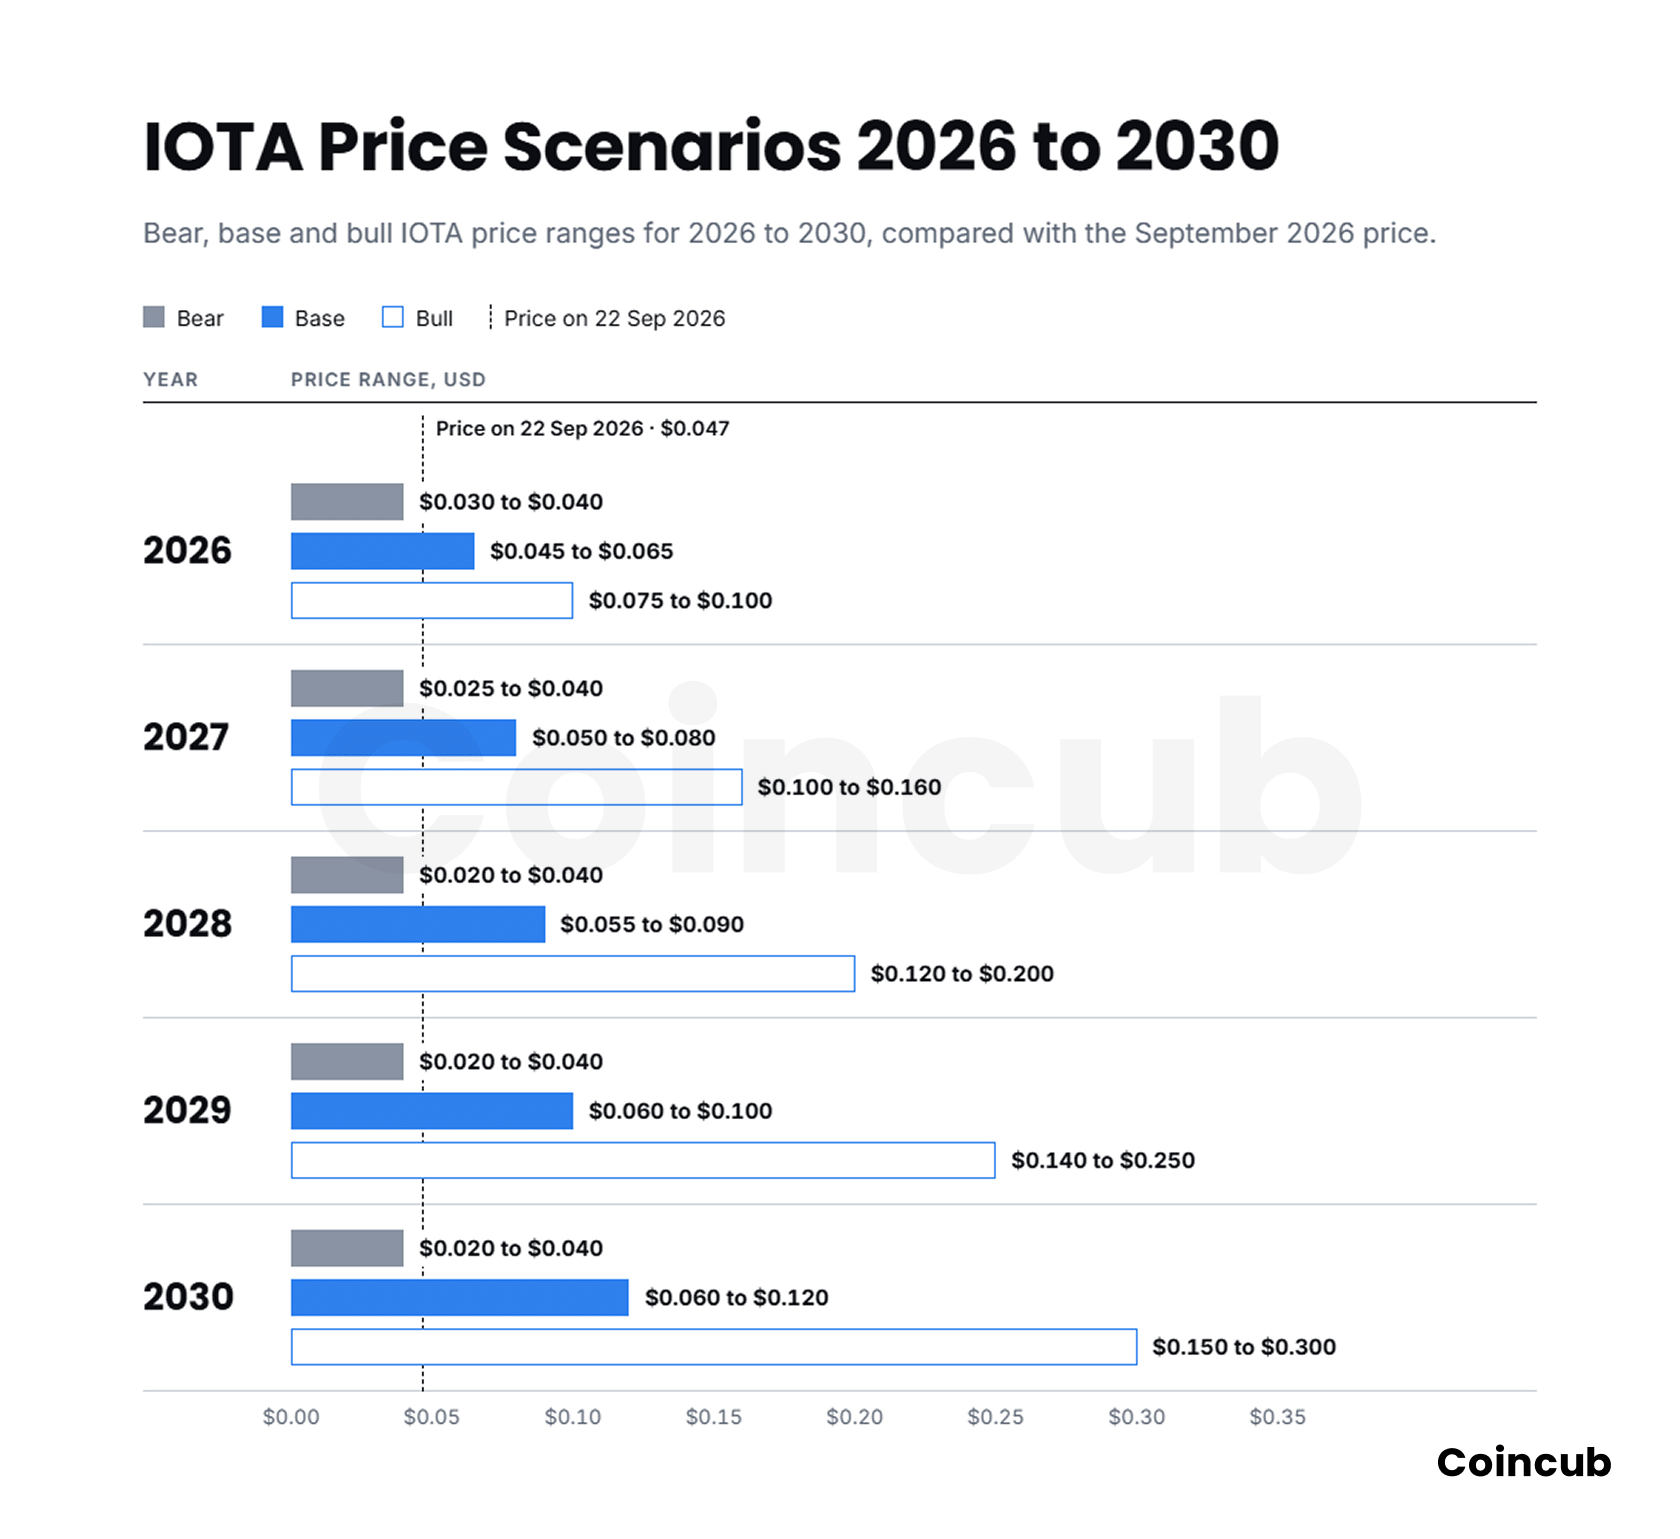
| 2026 (year end) | 4.8B IOTA | $0.030 to $0.040 | $0.045 to $0.065 | $0.075 to $0.10 |
| 2027 | 5.3B IOTA | $0.025 to $0.040 | $0.05 to $0.08 | $0.10 to $0.16 |
| 2028 | 5.6B IOTA | $0.02 to $0.04 | $0.055 to $0.09 | $0.12 to $0.20 |
| 2029 | 5.9B IOTA | $0.02 to $0.04 | $0.06 to $0.10 | $0.14 to $0.25 |
| 2030 | 6.2B IOTA | $0.02 to $0.04 | $0.06 to $0.12 | $0.15 to $0.30 |
IOTA Price Prediction for 2026
With just over three months left, the IOTA price prediction for 2026 rests mainly on market structure. IOTA rose about 11.7% over the past week, according to CoinGecko, yet daily trading volume of $7 million to $8 million is thin for a $220 million asset, so price moves can be sharp in both directions.
Network development, by contrast, has been steady. The Starfish consensus engine went live on mainnet on 23 April 2026, allowing the network to keep running when some validators fall behind, as described in the IOTA Foundation’s Starfish announcement. According to the IOTA and TWIN Q2 2026 progress update, Kenya, Nigeria and Morocco are the first countries in the ADAPT trade digitisation programme, and five core signatories have joined a UK maritime trade memorandum.
Staking economics are just as important. About 2.4 billion IOTA, or roughly 48% of supply, is staked at a reward rate near 11.7%, according to Staking Rewards’ IOTA data, against annual inflation of about 6%. If you’re new to the mechanics can start with how crypto staking rewards are earned.
Taking these together, our bear case of $0.030 to $0.040 assumes a retest of July’s low, the base case of $0.045 to $0.065 assumes consolidation, and the bull case of $0.075 to $0.10 requires a broad altcoin rally.
IOTA Price Prediction for 2027
Looking further out, 2027 is when IOTA’s supply picture changes. The final scheduled unlocks end in late September 2027, after which new supply comes only from staking emissions. Our base case assumes that trade pilots move into production in at least some ADAPT countries and that DeFi grows from a very small base.
That base really is small. DeFi total value locked (TVL), meaning the value deposited in on-chain applications, stood at about $1.8 million excluding liquid staking, according to DefiLlama. Protocols such as Swirl, Pools Finance and Virtue give the Move ecosystem a foundation, but token demand depends on whether they attract real capital. Validator growth matters too, since the whitepaper describes plans to expand the validator committee beyond its initial 50 members.
Accordingly, our 2027 bear case sits at $0.025 to $0.040, the base case at $0.05 to $0.08 and the bull case at $0.10 to $0.16.
IOTA Price Prediction 2030
By 2030, the long-term case for IOTA rests on enterprise trade and real-world assets (RWAs), meaning physical or financial assets represented on a blockchain. The IOTA 2025 review highlights the Salus project for tokenised trade finance in critical minerals, a GLEIF partnership for verifiable business identities and a LayerZero integration linking IOTA to more than 150 networks. Similar tokenisation themes sit behind the XDC Network price outlook.
On valuation, we assume about 6.2 billion IOTA in circulation by 2030. On that basis, our IOTA price in 2030 ranges from $0.02 to $0.04 in the bear case, where adoption stalls and dilution continues, to $0.06 to $0.12 in the base case. The bull case of $0.15 to $0.30 implies a market cap of roughly $0.9 billion to $1.9 billion and requires trade and RWA flows to generate meaningful fees across the layer-1 and any connected chains.
IOTA Tokenomics and Their Impact on Price
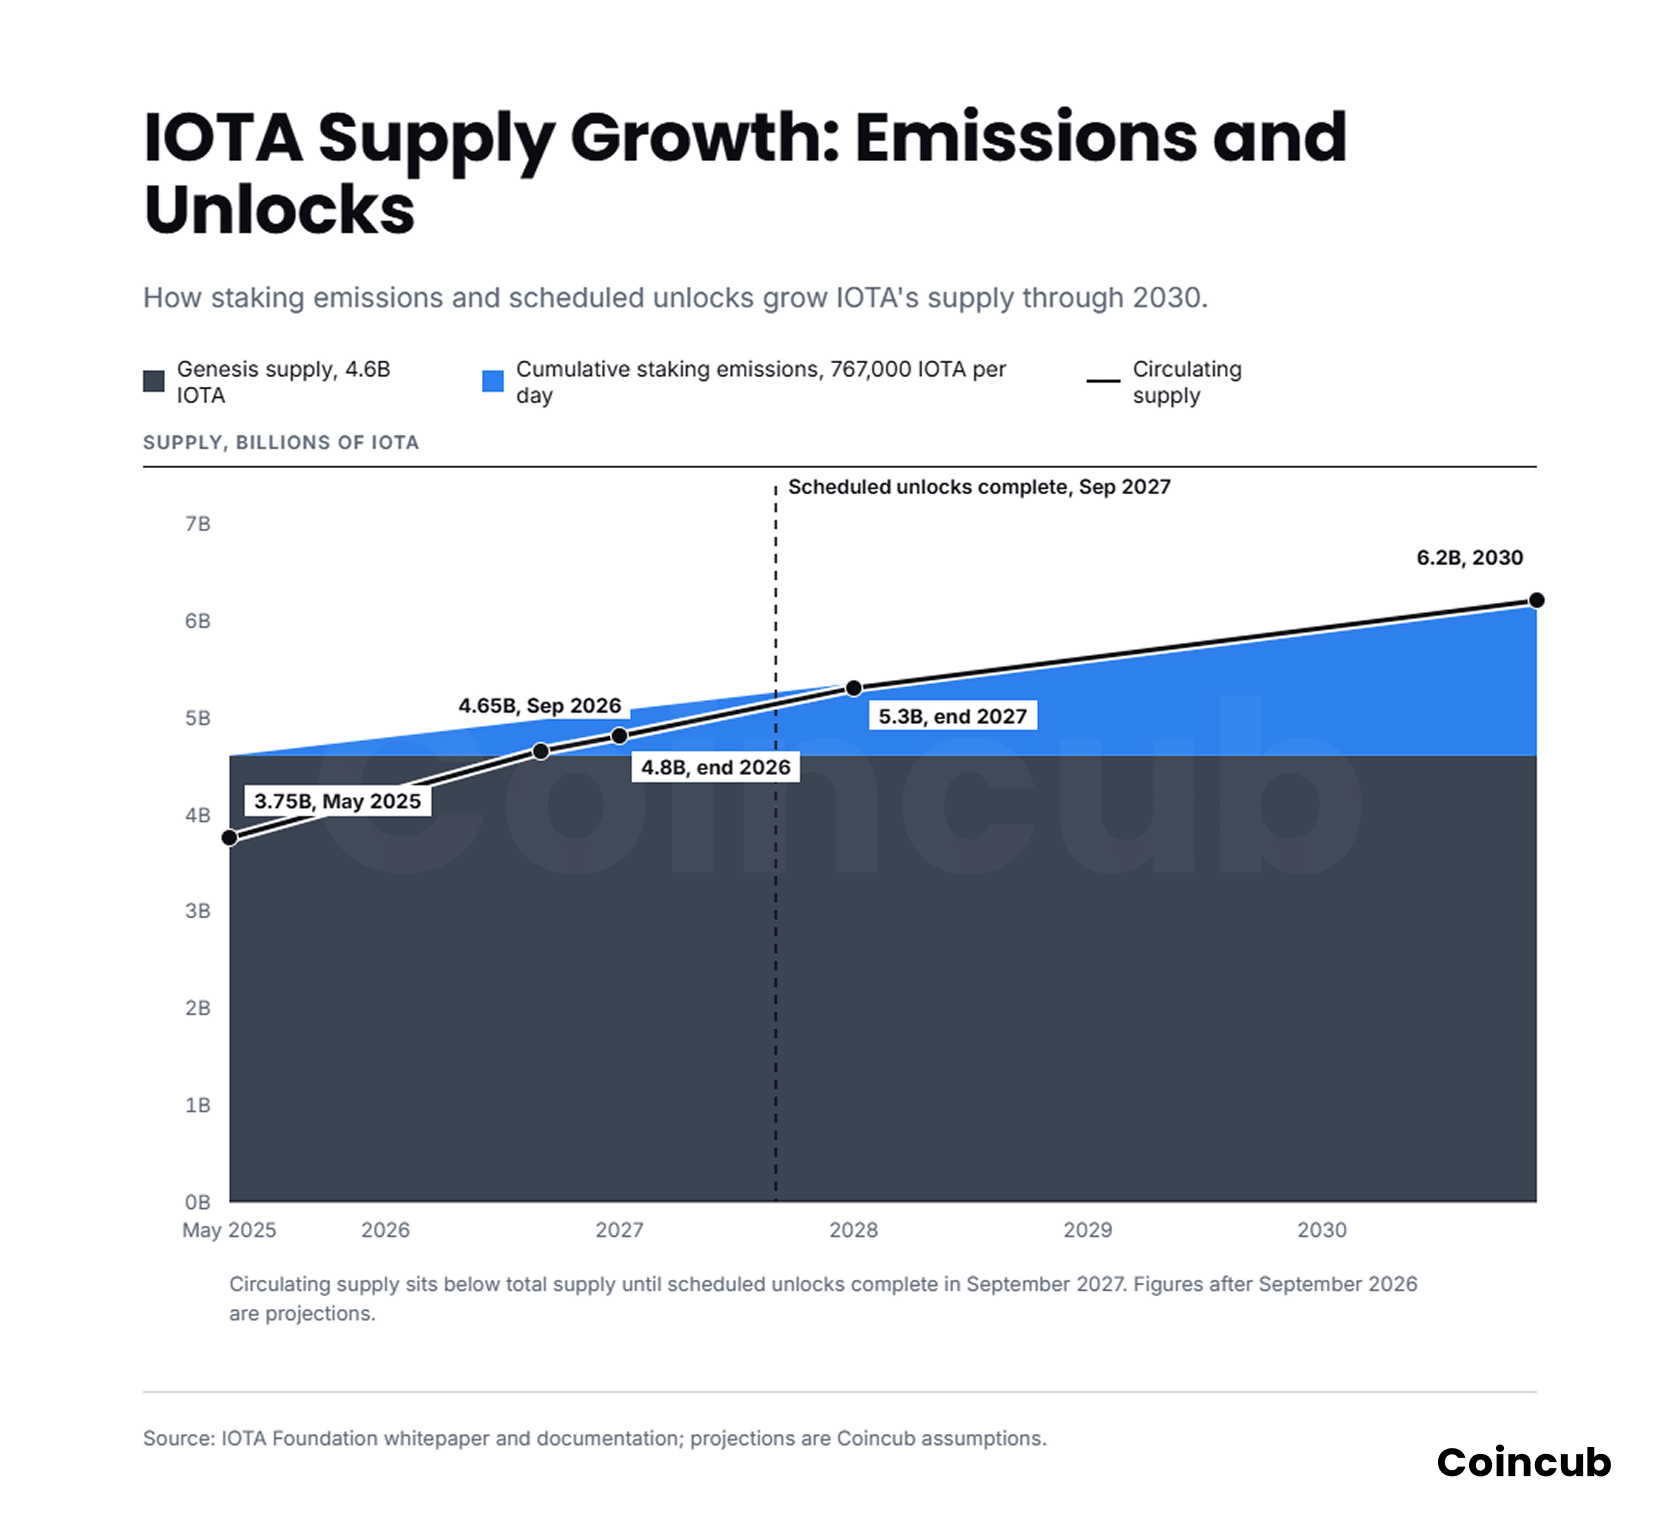
Because supply growth drives so much of the outlook, IOTA’s tokenomics deserve a closer look. According to the IOTA token documentation, 4.6 billion IOTA migrated to the new network at genesis, and IOTA has no fixed maximum supply. Instead, the protocol mints 767,000 IOTA per epoch, where an epoch lasts about 24 hours, to fund staking rewards.
Emissions, Fee Burning and Unlocks
That subsidy adds roughly 280 million IOTA a year, which the IOTA Technical and Tokenomics Whitepaper puts at an initial inflation rate of about 6%. Part of every transaction fee is burned, yet at current activity levels burning offsets only a small share of new supply.
Circulating supply also grows through scheduled unlocks. The whitepaper sets out biweekly unlocks of about 12.4 million IOTA until 29 September 2027, which leaves roughly 320 million IOTA still to be released. For valuation, this means IOTA needs rising demand just to hold its price, while stakers are partly protected because their rewards exceed the inflation rate.
What Could Drive IOTA Higher?
Given that dilution, the upside depends on demand growing faster than supply. Real-world adoption is the biggest lever, especially if ADAPT and TWIN turn government trade pilots into daily on-chain activity. Smart contracts come next, because Move-based DeFi would create steady fee demand.
Beyond that, LayerZero connectivity and any future app-specific chains or layer-2 networks could bring liquidity, provided their activity settles on the layer-1. RWA tokenisation in trade finance adds an institutional use case, strong staking demand already locks up nearly half of supply, and stablecoins, given their growing role in global payments, are a useful signal to watch.
What Could Push IOTA Lower?
Every driver has a counterweight. Competition is intense, because larger layer-1 networks and specialist tokenisation chains such as those behind the Chainlink price prediction compete for the same institutions. Slow ecosystem growth is another risk, since TVL under $2 million leaves little organic fee demand.
On top of that, token dilution continues at about 6% a year, and weak demand for network activity would leave fee burning too small to offset it. Execution risk also remains, because government trade programmes move slowly and can stall.
IOTA Price Prediction Methodology
Given how much supply shapes the outcome, our IOTA forecast uses a market-cap approach. We estimate a plausible market cap for each scenario, then divide it by expected circulating supply. Supply assumptions add 767,000 IOTA a day in emissions plus the remaining scheduled unlocks, with only a small allowance for fee burning.
Adoption scenarios then set the market cap, from stagnant use in the bear case to meaningful trade, RWA and DeFi volume in the bull case. IOTA’s 2017 valuation reflected a different network and a speculative market, so this IOTA token prediction treats it as context rather than a target.
Is IOTA a Good Investment?
Whether IOTA fits a portfolio depends on each reader’s goals and risk tolerance, so this article gives no buy or sell verdict. Instead, investors would need to weigh adoption against speculation: government trade programmes are real, yet on-chain activity is still small.
Beyond that, unstaked holders are diluted by about 6% a year, the rebuilt network is young and depends on the Foundation’s execution, and volatility remains high. Readers comparing options can review the best crypto to buy in 2026 or compare other crypto price predictions.
Frequently Asked Questions (FAQ)
Can IOTA reach $1? +
IOTA reaching $1 would require a market cap of about $6.2 billion on the roughly 6.2 billion tokens we expect by 2030, about 28 times its September 2026 value. Our scenarios top out at $0.30, so $1 would need adoption far beyond the bull case.
Can IOTA reach $5? +
A $5 IOTA would imply a market cap of about $31 billion by 2030, placing it among the largest cryptocurrencies. Current network activity, TVL and fee data give no support for that level within this forecast period, so we treat it as highly unlikely.
Can IOTA reach $10? +
IOTA at $10 would imply a market cap above $60 billion, more than 250 times its September 2026 valuation. Because supply keeps growing through staking emissions, that target is out of reach under any scenario in this forecast.
What will IOTA be worth in 2030? +
Our 2030 base case places IOTA between $0.06 and $0.12, with a bear case of $0.02 to $0.04 and a bull case of $0.15 to $0.30. These ranges assume about 6.2 billion tokens in circulation and may differ widely from actual prices.
Is IOTA inflationary? +
Yes, IOTA is inflationary. The protocol mints 767,000 IOTA per daily epoch to fund staking rewards, about 6% a year at launch, and has no fixed maximum supply. Burned transaction fees offset part of that inflation, and heavier network use would offset more.