


 Buy a Licensed Company
  Explore VASP Data
  Talk to an Expert


How to Objectively Value Bitcoin During a 50% Crash

- A 50% Bitcoin crash, on its own, does not tell you whether the bull market has ended. Corrections this deep have appeared inside bull runs and bear markets alike.
- Price is a single number with no memory. To judge value you need a reference point, and Bitcoin’s public ledger gives you one no stock can offer.
- Realized price acts as the network’s aggregate cost basis. In July 2026, spot sits about 19% above it, so the average holder is only modestly in profit.
- The MVRV Z-Score, currently 0.37, has flagged every cycle top to within about two weeks and every accumulation zone. It measures valuation, not timing.
- Six metrics together beat any single one: realized price, MVRV Z-Score, the 200 week moving average, long term holder supply, exchange balances and cost of production.
- Valuation signals and flow signals currently disagree. That tension is normal during a Bitcoin crash and usually resolves over months, not days.
- The real edge is a written process. Decide your actions and your invalidation conditions while you are calm, then follow them when you are not.
Why a Crash Breaks Your Judgment Before It Breaks Your Portfolio
Picture the investor who checked the price every few minutes on the way up and now cannot stop checking it on the way down. A 50% crash, be that of Bitcoin or any asset, does two things to that person at once. First, it halves the value of their holdings. Second, and more dangerously, it halves their ability to think clearly. The second effect is the one that empties accounts. Investors who sell at the bottom rarely do so because a metric told them to. They sell because the chart has become painful to look at, and pain is a poor analyst.
The remedy is not blind optimism, and it is certainly not conviction dressed up as analysis. The remedy is a checklist you can run when your instincts are least reliable. Bitcoin is unusually well suited to this approach because it settles on a public ledger. You can measure what holders actually paid, watch what they are doing right now, and compare today’s price against the network’s own cost basis.
Consider what that means relative to traditional markets. A stock investor cannot see the average purchase price of every shareholder, nor watch large holders move their positions in real time. A Bitcoin investor can do both. That transparency will not hand you a bottom, but it does turn a crash from a wall of noise into a set of readable signals. The rest of this guide walks through six of those signals, explains what each one measures, and, just as importantly, tells you where each one lies to you.

Why Price Alone Tells You Almost Nothing
Price is produced by the last trade that happened, and nothing more. It carries no information about who traded, why they traded, or what they paid originally. During a crash the problem gets worse, because a relatively small amount of forced selling can drag price a long way in a thin market.
Consider June 2026 as a case study. Bitcoin fell 20.48% in a single month, its worst month of the year. Spot Bitcoin ETFs recorded $4.5 billion of outflows, the largest monthly figure on record, and Citi cut its twelve month inflow forecast to zero. Together, those forces pushed BTC to a 21 month low and opened July at its weakest level since late 2024.
Here is the distinction most headlines blur. ETF outflows are a flow measure, not a value measure. They tell you that some holders wanted out during a specific window. They say nothing about whether the asset is cheap or expensive. A stock can suffer heavy redemptions and still be undervalued, and the same is true of Bitcoin. To judge value rather than mood, you need an anchor. For Bitcoin, that anchor is what the network as a whole paid for its coins, which brings us to the first tool.
6 Tools to Value Bitcoin During a Crash
Realized Price, the Network’s Cost Basis
Realized price is the simplest useful valuation anchor in crypto, and once you understand it, the rest of the toolkit becomes easier. Every bitcoin carries a timestamp for when it last moved onchain. Take the market price at each of those moments, add them all together, and divide by the number of coins in circulation. The result is the average price at which the entire supply last changed hands.
In effect, realized price is the aggregate cost basis of the market. When spot price falls below it, the average holder is underwater. That condition has been rare across Bitcoin’s history, and importantly, it has never persisted through an entire cycle.
Reading the July 2026 Figure
As of July 2026, the raw MVRV ratio is 1.19. That number is simply spot price divided by realized price, so a reading of 1.19 means market price sits about 19% above the network’s average cost basis. That is not underwater, but by historical standards it is close. During the bull phase of late 2025, the same ratio was far higher, which tells you how much froth has already been wrung out. Treat realized price as a floor zone rather than a hard floor. Price dipped beneath it in 2015, 2018 and 2022, and it recovered every time, though recovery took months rather than days.
The Mvrv Z-Score, Your Overvaluation Thermometer
The MVRV Z-Score, developed by Murad Mahmudov and David Puell, builds directly on realized price. It takes the gap between market value and realized value, then divides that gap by the standard deviation of market value. In plain language, it asks a single question: how unusual is today’s premium compared with Bitcoin’s own history?
The score has proven remarkably good at one specific job. It has identified the top of every Bitcoin cycle to within about two weeks. Readings above 6.5 have consistently preceded major corrections, while readings near zero have marked accumulation zones where recoveries later began.
As of 13 July 2026, the MVRV Z-Score reads 0.37. That is a low number, and it places Bitcoin near its realized value, well beneath any elevated historical range. In 2014, 2018 and 2022, major recoveries began only after the score entered this zone. There were reports in June 2026 that this metric was among the clearest signals that the worst of the crash might already be behind the market.
Now for the caveat, because it matters more than the signal itself. Low does not mean bottom. In both the 2018 and 2022 cycles, the Z-Score sat in the low zone for several months before price actually turned. The metric measures valuation, not timing, and anyone who sells you those two things as identical is selling you something else entirely. Use it to know where you stand, not to predict the next candle.
The 200 Week Moving Average
The 200 week moving average smooths price across roughly four years, about one full Bitcoin cycle including a halving. Because the window is so long, short term panic barely nudges it. That sluggishness is precisely why it earns a place in your toolkit during a crash.
Historically, Bitcoin has traded below its 200 week moving average only during the deepest phases of bear markets, and usually only briefly. It is a blunt instrument that lags badly, yet during a crash that lag becomes a feature. The line cannot be spooked by a single ugly week, so it gives you a stable frame of reference when everything else is shaking.
How to Read Your Position Against the 200 Week Moving Average?
The practical check is simple. Measure the distance between spot price and the 200 week line. If price sits above it, the long term trend structure remains intact even if the last six months have been brutal. If price sits below it, you have entered the rarer and deeper category of a crash, and your time horizon needs to stretch to match. Either way, you now hold a fact rather than an impression.
Long Term Holder Supply
Chain analysts divide holders into two groups. Short term holders have held their coins for less than 155 days, while long term holders have held longer. This split matters because the two cohorts behave very differently under stress, and their behaviour reveals what kind of selling is actually driving the price down.
Short term holders sell during crashes. That is nearly a law of nature. Long term holders usually do not, and on the rare occasions they do, it tends to signal something structural rather than emotional. So during a 50% crash, the question worth answering is this: is the selling coming from recent buyers capitulating, or from old coins moving for the first time in years?
You can track this through long term holder supply, the total number of coins held by the long term cohort. When that supply rises during a crash, older and steadier holders are absorbing coins from panicked sellers, which is historically a constructive sign. When it falls, the conviction cohort is shrinking, and that deserves closer attention. Watch the direction of the line rather than its absolute level, because the level alone means little without context.
Exchange Balances and Available Supply
Coins sitting on exchanges can be sold quickly. Coins in self custody generally cannot. Tracking the total balance held on exchanges therefore gives you a rough proxy for how much supply is positioned for immediate sale, which in turn hints at potential near term selling pressure.
That said, this metric has grown less reliable than it once was, and you should understand why before leaning on it. A growing share of large trades now settles off exchange through OTC desks, which do not always leave a visible onchain footprint. Custody has also shifted, with ETFs and institutional custodians holding coins in structures that never appear as exchange balances. The signal still works, but it now covers a smaller slice of real activity than it did in 2019. Treat a falling exchange balance as suggestive rather than conclusive.
The Cost of Production
Miners operate with a measurable break even price, driven by electricity costs, hardware efficiency and network difficulty. When price falls near or below the average cost of production, some miners power down, difficulty adjusts lower, and the remaining miners become more profitable. That feedback loop creates a rough economic floor beneath the market.
Crucially, this floor is soft rather than hard. Miners can and do run at a loss temporarily, and heavy miner selling can push price below the production line in the short run. Over full cycles, however, Bitcoin has spent little time meaningfully below aggregate production cost. Use the metric as a final check rather than a trigger. When price sits far above production cost, the argument gives you nothing useful. When price approaches it, you have entered territory where the supply side begins to constrain further downside.
The Six Metric Checklist
Individually, each of these tools has a blind spot. Together, they form a fuller picture. Run through the table below whenever the market drops sharply, and note where the signals agree and where they clash.
| Metric | What it measures | Signal it gives | Where it fails | July 2026 reading |
| Realized price | Average cost basis of all coins | Whether the average holder is in profit | Says nothing about timing or duration | Spot about 19% above it |
| MVRV Z-Score | How unusual the current premium is | Over and undervaluation extremes | Can sit low for months before recovery | 0.37, accumulation zone |
| 200 week moving average | Four year price trend | Whether the long term structure holds | Lags heavily, slow to react | Check live chart before acting |
| Long term holder supply | Coins held over 155 days | Conviction versus capitulation | Cohort boundary is arbitrary | Watch direction, not level |
| Exchange balances | Supply available for fast sale | Potential near term sell pressure | Misses OTC and custodial flows | Declining data coverage |
| Cost of production | Miner break even price | Rough economic floor | Miners can run at a loss for a while | Use as a final check |
How This Crash Compares to Previous Ones
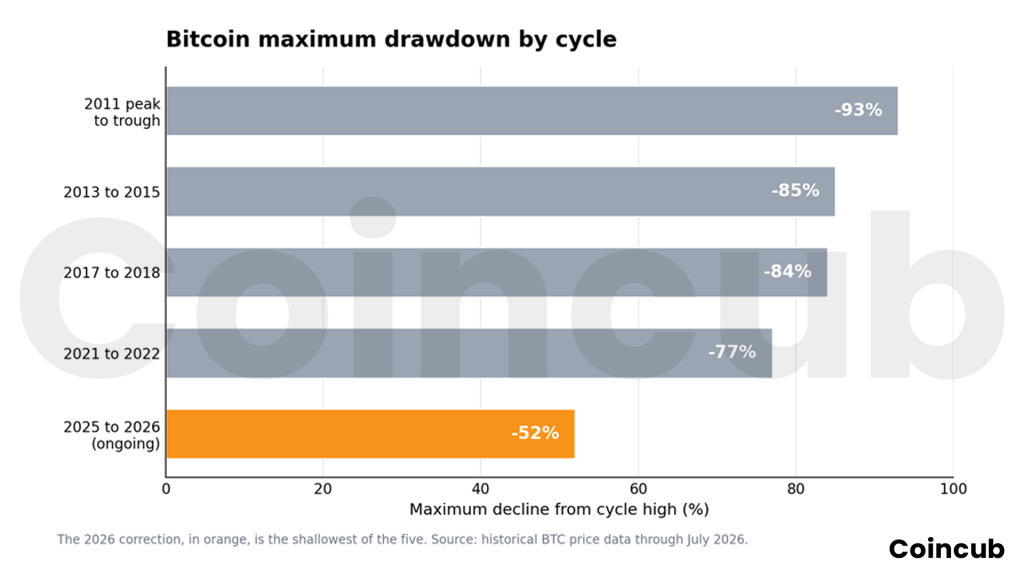
Bitcoin has walked this road before, and the history is worth studying precisely because it is both consistent and imperfect. The chart below places the 2026 Bitcoin crash alongside the major corrections of past cycles.
Two Lessons From Historical Patterns
Two observations follow from this history. First, drawdowns of 50% have occurred inside bull markets as well as bear markets, so a 50% fall by itself cannot tell you which regime you are in. Second, the deepest corrections reached roughly 85% to 93%, a sobering reminder that a 52% drawdown still has room to worsen before it improves. History rhymes here, but it does not repeat on command, and treating four data points as destiny is its own kind of mistake.
Your 20 Minute Bitcoin Valuation Routine
Knowing the metrics is only half the job. The other half is running them in a fixed order so that emotion never sets the agenda. The routine below takes about twenty minutes and works whether the market is soaring or collapsing.
Steps 1 to 3: Establish the Facts
- Begin by writing down the crash, which is current price divided by all time high. For Bitcoin, in July 2026 that is roughly $60,000 divided by $126,000, or about a 52% crash. Record the number before you look at anything else, so your starting point is a fact rather than a feeling.
- Next, check the MVRV Z-Score using a free source such as Bitcoin Magazine Pro, CoinGlass, Newhedge or bgeometrics, and note whether it is rising or falling.
- Then compare spot to realized price using the MVRV ratio, where above 1 means the average holder is in profit and below 1 means they are not.
Steps 4 to 7: Interpret and Decide
- With the facts in hand, move to interpretation. Check whether price sits above or below the 200 week moving average, since that single reading frames your time horizon.
- After that, look at holder behaviour and ask whether long term holder supply is rising or falling.
- Then scan for structural news, because metrics only measure the past, and a protocol failure, exchange collapse or regulatory ban would change the underlying case in ways no chart prices in immediately.
- Finally, decide your action in advance and write it down. Not what you feel like doing at the moment, but what you already decided to do at each price level before that level arrived.
The Mistake Almost Everyone Makes During a Bitcoin Crash
There is a story that repeats in every cycle. An investor builds a thesis at the top, watches it break, then constructs a brand new thesis at the bottom that conveniently justifies selling. The new thesis always feels more sophisticated than the old one, and it almost always arrives within days of the low. This is not stupidity. It is the mind protecting itself from pain by rationalizing a retreat.
How to Defend Against Your Own Narrative
The defence is boring, and it works. Write your thesis down while you are calm, including the specific conditions that would prove it wrong. Then, during a crash, check whether those exact conditions have been met, rather than whether you feel differently. For Bitcoin, genuine invalidation conditions might include a consensus level protocol failure, a sustained collapse in hash rate that never recovers, a coordinated regulatory ban across major economies, or the arrival of a technically superior settlement network with real adoption. A 50% price drop is not on that list, because Bitcoin has produced crashes of that size or larger in nearly every cycle it has lived through.
What These Metrics Cannot Tell You
Every metric in this guide is descriptive rather than predictive. They tell you where you are, not where you are going, and honesty about that limit is what separates analysis from fortune telling. There is also a sample size problem worth stating plainly. Bitcoin has completed only about four cycles, and any pattern drawn from four observations is a weak pattern. Analysts who speak with total confidence about what happens next are extrapolating from a data set that would fail basic scrutiny in almost any other field.
The market structure has shifted too, which further weakens the historical playbook. Spot ETFs did not exist in previous cycles. Corporate treasury holdings were negligible before 2020, yet by June 2026 there were 188 public entities and governments holding a combined 1,893,116 BTC, worth around $139 billion and representing about 9% of total supply. That is a materially different market from the one that produced the old patterns. None of this argues for paralysis. It argues for humility, because imperfect measurement still beats no measurement at all.
What This Means in July 2026
Here is what the current data set says, stated plainly and without a recommendation attached. Bitcoin is about 52% below its cycle high. The MVRV Z-Score is 0.37, historically a level associated with accumulation rather than distribution. Spot price sits about 19% above the network’s average cost basis, so the typical holder is only modestly in profit.
Meanwhile, ETF flows were sharply negative in June, the worst month on record for outflows, and the macro picture is dominated by an upcoming Fed decision, with analysts watching $56,200 as support and $63,800 as the level that would break the downtrend.
Notice that the valuation metrics and the flow metrics currently point in opposite directions. Valuation says cheap relative to history, while flows say sellers remain in control. That disagreement is not a flaw in the analysis. It is a normal feature of this stage of a Bitcoin crash, and it usually resolves over months rather than weeks.
What you do with that tension depends on your own time horizon, risk tolerance and financial situation. This is information, not financial advice, and nobody reading a chart in July 2026 knows where Bitcoin trades in December. What you can control is the quality of your process, and that habit will serve you across every cycle, including the ones that have not happened yet.
Frequently Asked Questions (FAQ)
What is a good MVRV Z-Score for buying Bitcoin? +
Historically, readings below 1 have coincided with accumulation zones, while readings above 6.5 have preceded major corrections. The July 2026 reading of 0.37 falls firmly in the low range. Remember that the score identifies valuation extremes rather than the exact timing of reversals.
How far has Bitcoin fallen from its all time high? +
As of July 2026, Bitcoin trades near $60,000 against an October 2025 peak of $126,000, a drawdown of roughly 52%.
Does a 50% Bitcoin crash mean the bull market is over? +
Not by itself. Bitcoin has recorded drawdowns of 50% or more during bull markets as well as bear markets, so drawdown size alone does not identify the regime.
What is Bitcoin realized price? +
It is the average price at which all circulating bitcoin last moved onchain, calculated using the market price at each coin's last movement. It functions as the aggregate cost basis of the market.
Which free tools show these metrics? +
MVRV Z-Score charts are published by Bitcoin Magazine Pro, CoinGlass, Newhedge, MacroMicro, bgeometrics and Glassnode Studio. Most offer a free tier that covers the core metrics in this guide.